

Reducing Fluorescence Measurement Errors: Effective Strategies for High-Precision Data
Reducing fluorescence measurement errors is essential for ensuring accuracy and reliability in scientific research. Fluorescence measurement is a crucial technique, widely used for its sensitivity and precision in quantifying molecular interactions across various fields, from DNA and protein assays to environmental monitoring. However, achieving accurate fluorescence measurements requires careful control over potential error sources, as even minor inaccuracies can significantly impact data quality. This article explores the common sources of errors in fluorescence quantification and presents effective strategies to minimize them, supporting high-precision results essential for robust scientific analysis.
1. Common Sources of Fluorescence Measurement Errors
Errors in fluorescence measurement stem from various sources that impact fluorescence data precision:
- Excitation Source Errors: Instabilities in the light source or wavelength shifts often lead to signal variability, affecting fluorescence signal consistency.
- Sample Preparation Errors: Improper handling, concentration issues, or contamination can disrupt sample homogeneity, leading to fluorescence intensity variations.
- Instrumentation Errors: Detector sensitivity fluctuations, calibration drift, and instrument alignment issues are common in fluorescence spectrometers and create significant inaccuracies.
- Environmental Errors: Temperature changes, ambient light interference, and pH variations are environmental factors that introduce noise and reduce fluorescence measurement reliability.
Understanding these issues enables better control over the measurement environment and setup.
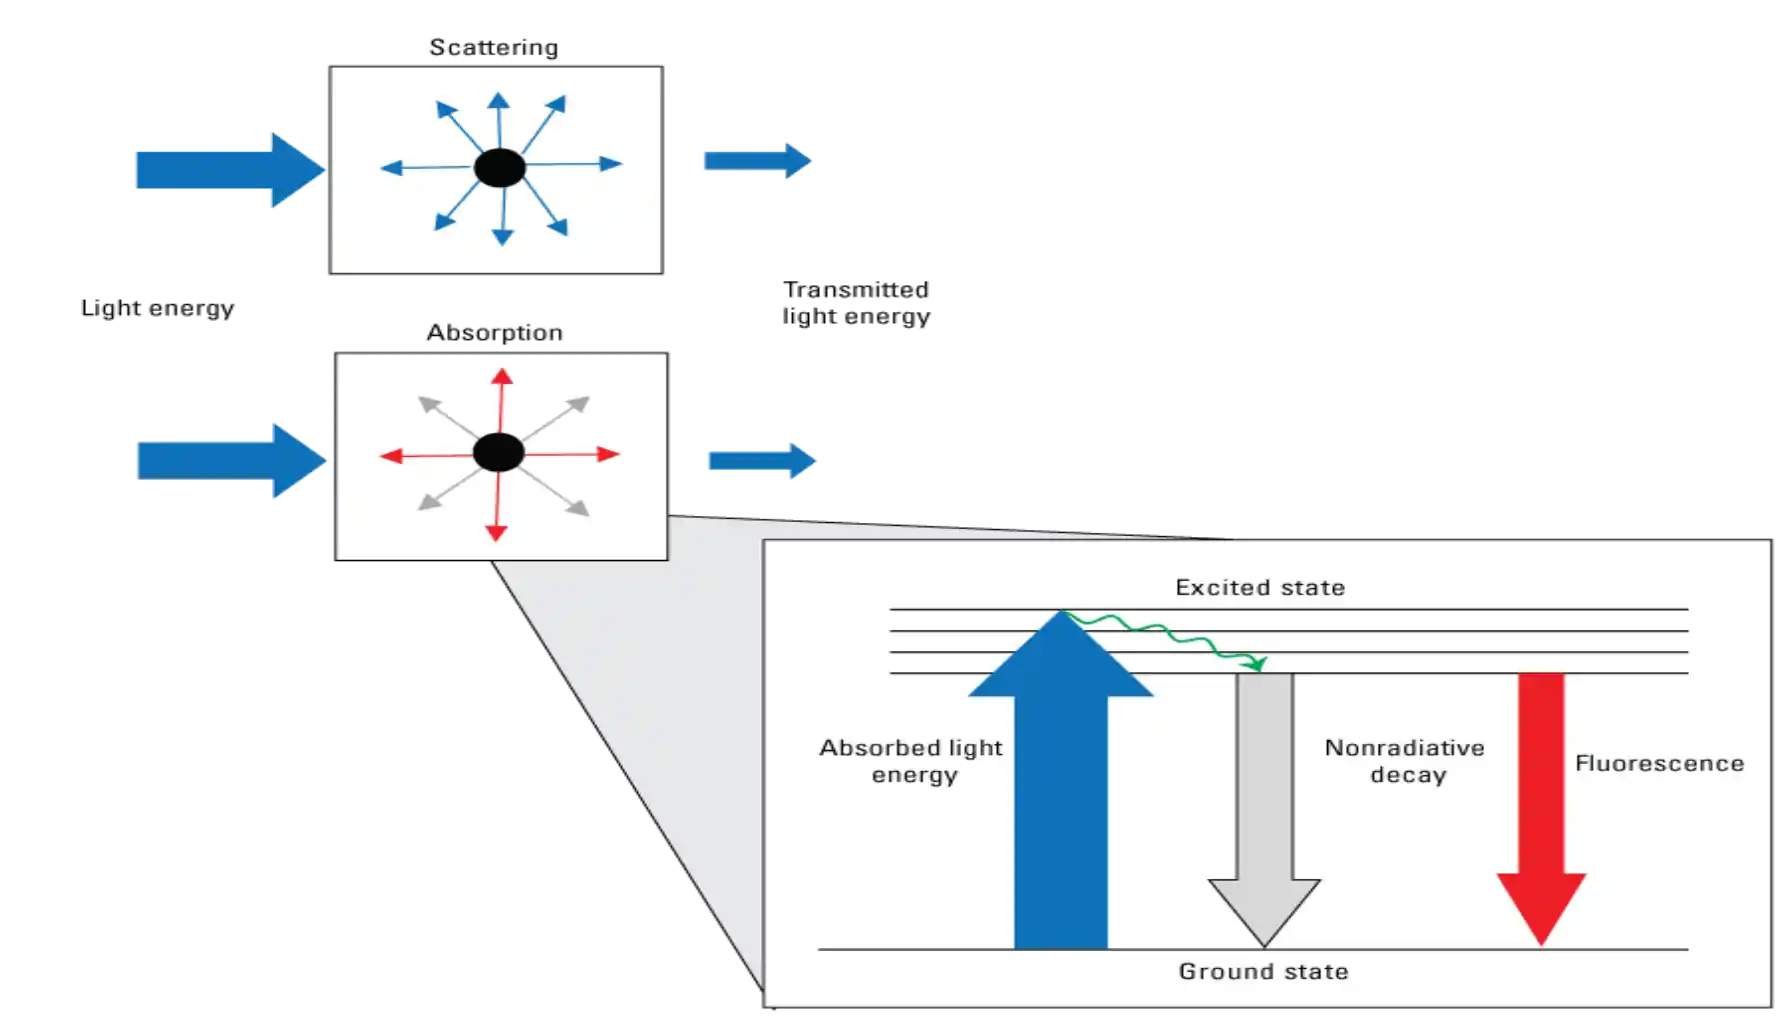
Figure1
Figure1: Pathways of Light Energy in Fluorescence Measurement
- Scattering: Part of the incoming light is scattered, reducing the transmitted light that reaches the sample.
- Absorption: Some light is absorbed, raising molecules to an excited state.
- Fluorescence: After non-radiative decay, energy is reemitted as fluorescence when molecules return to their ground state.
2. Key Strategies to Reduce Fluorescence Measurement Errors
Implementing best practices and proper calibration are essential to achieve accurate fluorescence quantification:
- Control the Excitation Source: Utilize stable light sources, regularly calibrate the excitation path, and adjust alignment to prevent fluorescence signal inconsistencies.
- Optimize Sample Preparation: Maintain sample concentration within the linear response range to avoid effects like reabsorption or concentration quenching. Filtering samples minimizes contamination, ensuring fluorescence signal integrity.
- Minimize Instrumentation Errors: Regularly calibrate the detector sensitivity, use proper detector gain settings, and prevent saturation or signal loss. Clean optical components to eliminate stray light interference.
- Stabilize Environmental Conditions: For improved fluorescence data accuracy, use temperature-controlled sample holders, shield against ambient light, and select appropriate cuvettes.
These steps significantly reduce fluorescence errors, resulting in more reliable data.
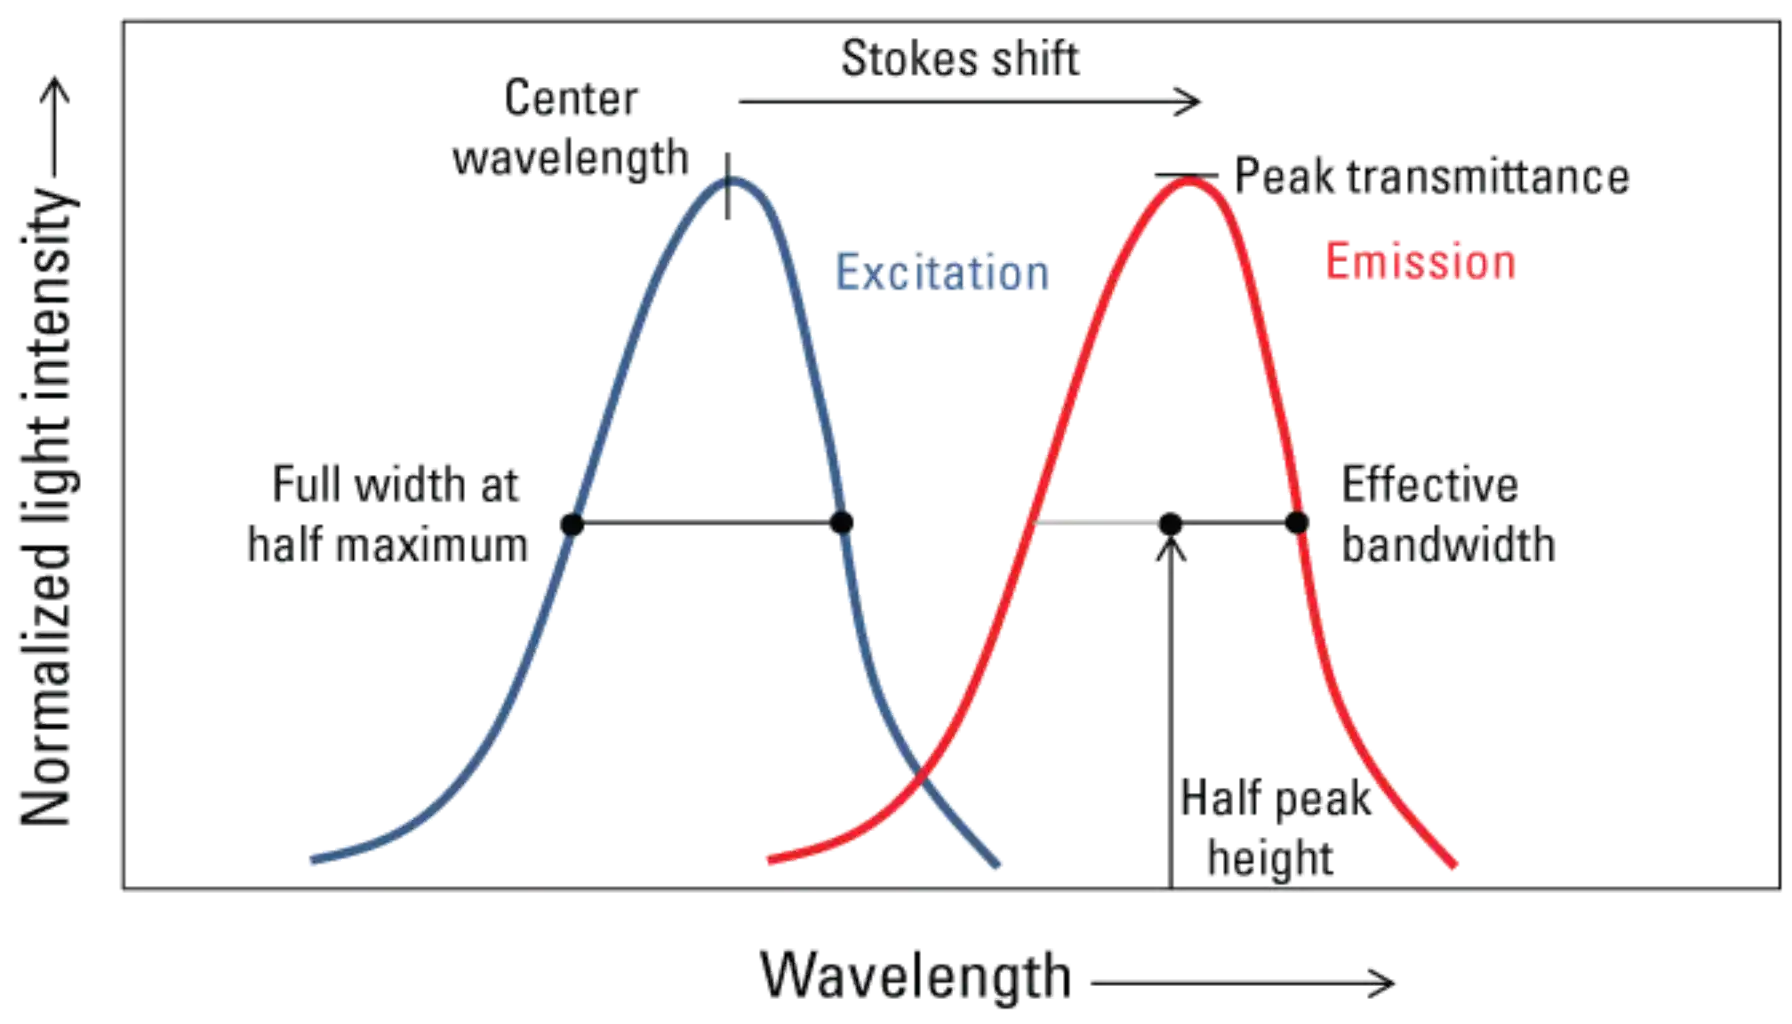
Figure 2
Figure 2: Excitation and Emission Spectra with Stokes Shift
- Excitation Peak: Shows the optimal wavelength for exciting the sample.
- Emission Peak: Indicates the emission wavelength after energy release.
- Stokes Shift: The difference between excitation and emission wavelengths, important for clear signal separation.
3. Addressing Specific Issues: Distorted or Weak Fluorescence Spectra
In some cases, fluorescence spectra may show unexpected peaks or weak emission. Here’s how to address common issues:
- Monochromator and Filter Adjustments: Ensure that monochromator filter wheels are active to eliminate unwanted wavelengths, which is crucial for avoiding artifacts like second-order peaks.
- Inner Filter Effect Correction: Adjust sample concentration to manage inner filter effects (both primary and secondary), which commonly occur in high-concentration samples and distort emission readings.
- Prevent Detector Saturation: At high signal intensities, detectors may saturate, resulting in spectral distortion. To prevent this, reduce excitation intensity or use an attenuator.
These troubleshooting techniques can help achieve clean, undistorted fluorescence spectra.
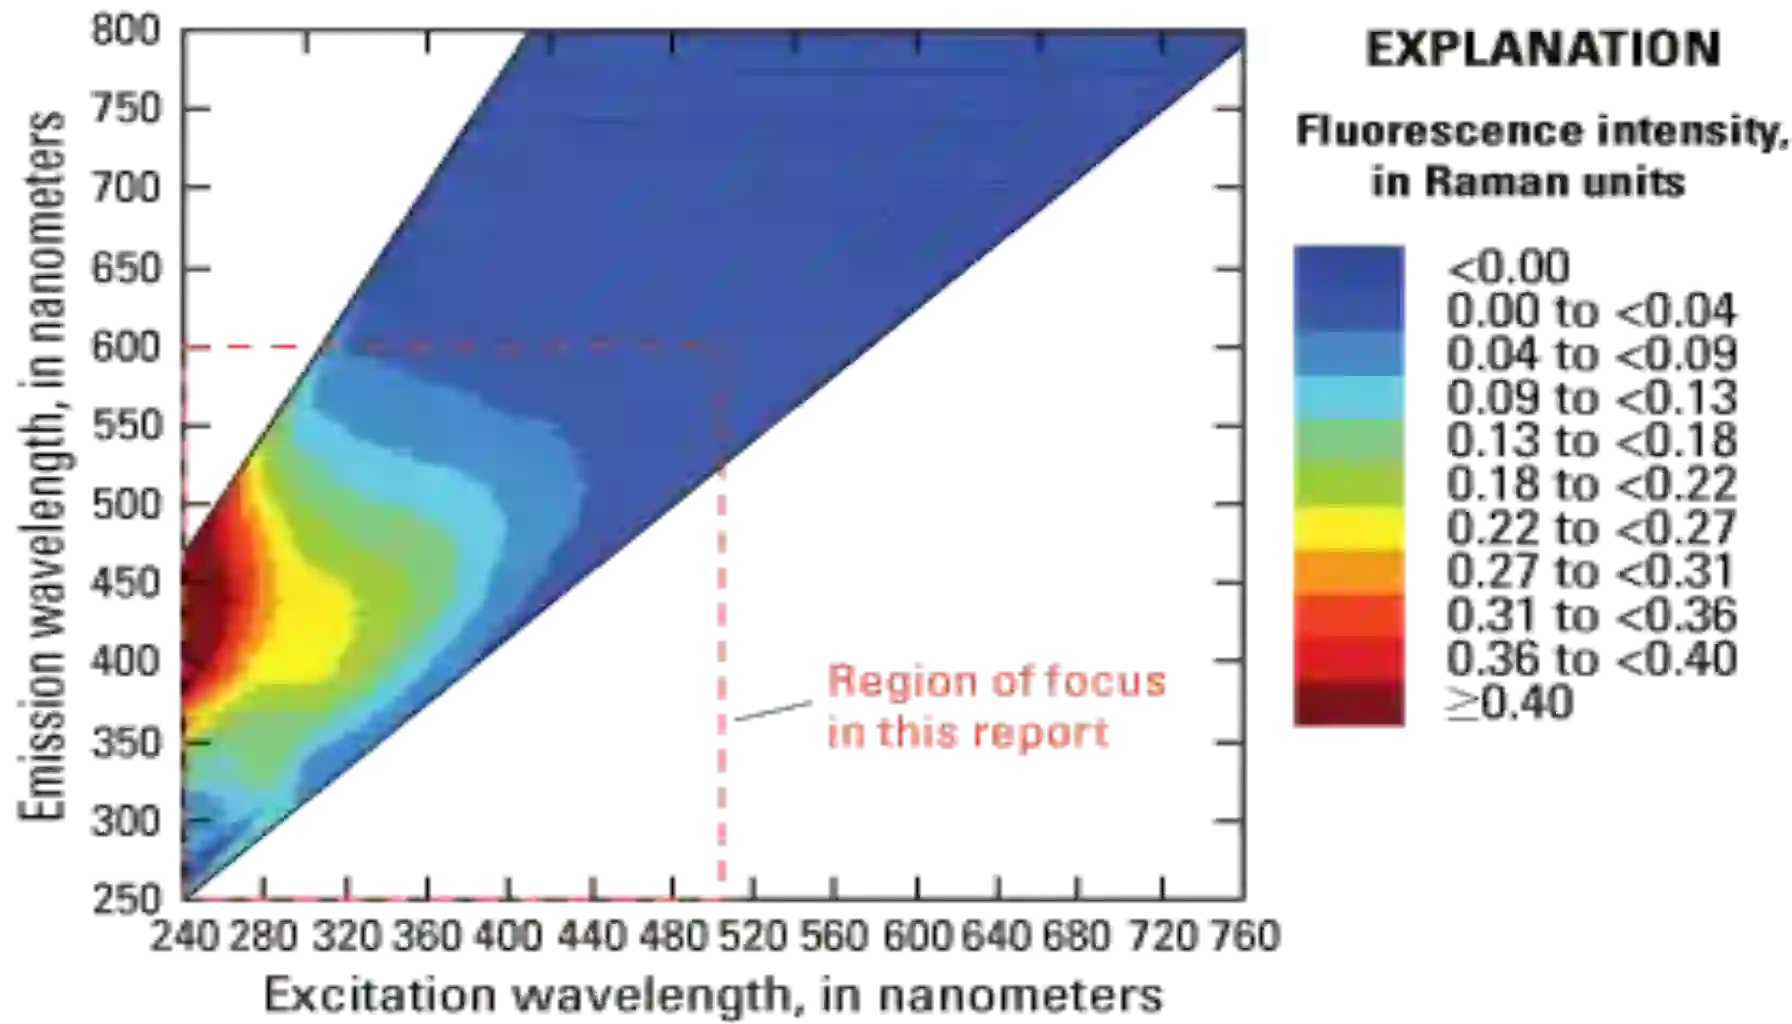
Figure3
Figure3: Fluorescence Intensity Map by Excitation and Emission Wavelengths
- Shows intensity variations across excitation and emission wavelengths.
- Helps in selecting optimal wavelengths to minimize errors in fluorescence measurement.
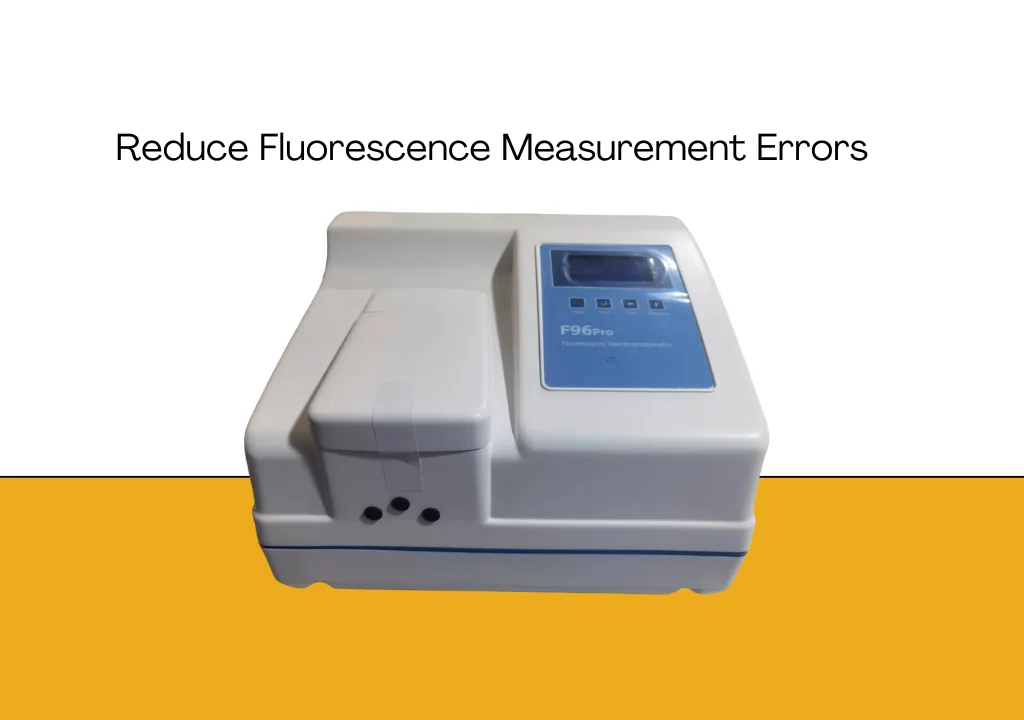
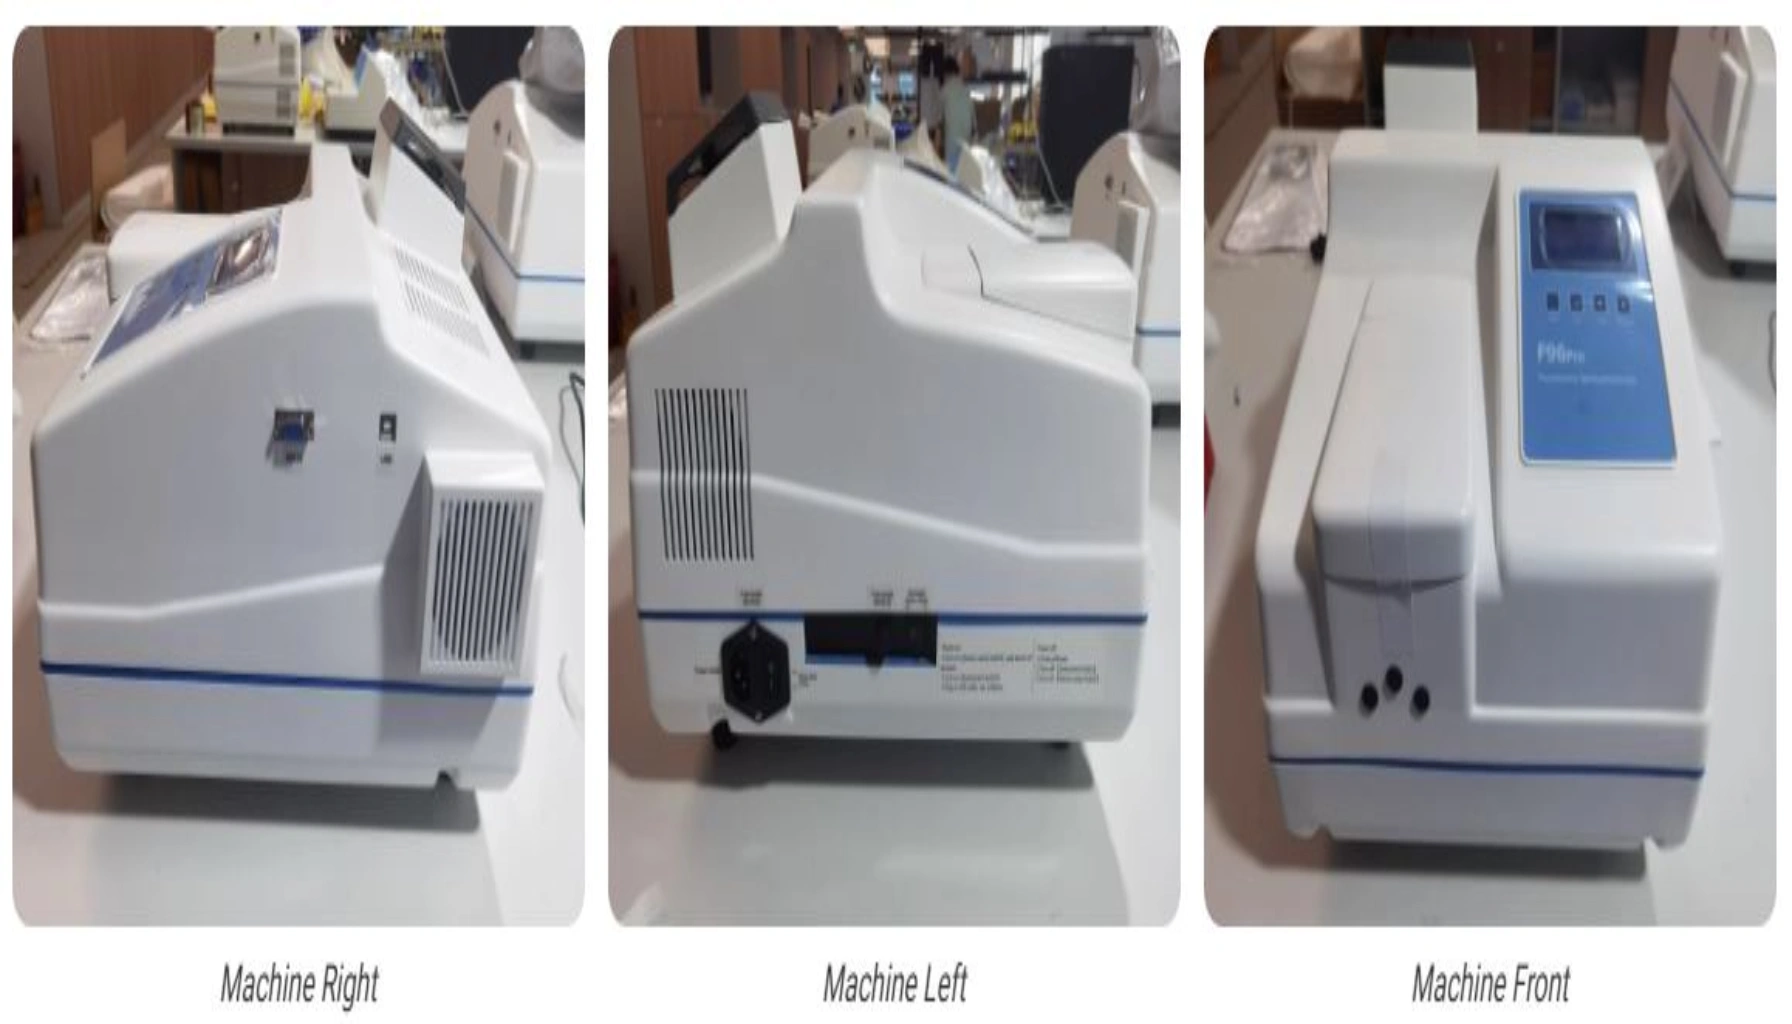
4. Ensuring Accurate Fluorescence Data with F96 Pro AELab
The F96 Pro AELab microplate reader is an advanced tool in fluorescence spectroscopy that provides precise measurements through key features:
- Temperature Control: Maintaining a stable temperature reduces intensity fluctuations caused by thermal variations, essential for temperature-sensitive samples.
- Automated Calibration and Filter Selection: The F96 Pro AELab offers automatic calibration and adjustable filter settings, ensuring accurate excitation and emission alignment. These features support reliable fluorescence readings and enhance reproducibility.
5. Improving Measurement Accuracy with F96 Pro AELab
The F96 Pro AELab facilitates efficient data acquisition and consistent fluorescence readings through:
- Multi-Sample Capability: This device allows simultaneous measurements across multiple samples, supporting data reproducibility in high-throughput studies.
- Real-Time Data Monitoring: Users can monitor fluorescence intensity changes in real-time, making it easy to detect anomalies and adjust parameters.
The F96 Pro AELab not only supports accurate fluorescence measurements but also minimizes common errors, making it an indispensable tool for high-precision fluorescence data in scientific research.