Analytical Equipment Guide: Methods, Use-Cases & Instrument Selection | AELAB
Analytical equipment refers to laboratory instruments used to identify, measure, and verify the composition and properties of samples in chemistry, materials, environmental testing, pharmaceuticals, food, and industrial quality control. In real projects, the “right instrument” is selected based on your analytical goal, the sample matrix, and the required sensitivity (LOD/LOQ) and precision—not by brand name or appearance.
This guide is built as a selection map. Use the 12 categories below to quickly match your application to the most common technique family, see what kind of data it produces, and understand the key factors that affect result quality. If you already know the technique you need, jump directly to the relevant section and open the instrument cards to view available models. If you’re not sure, use the Three Questions section at the bottom of this page to narrow down the best option, then contact us for a recommended configuration and quotation.
If you share your sample type, target analyte, and required LOD/LOQ, we can recommend the best technique and suitable instrument options.
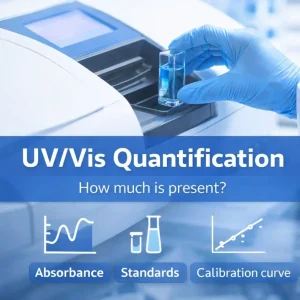
1) Routine Concentration / Colorimetric Tests
This section covers routine quantitative workflows where the key question is “how much is present?” and the method is built around UV/Visible absorbance—either direct absorbance at selected wavelengths or reagent-based color development (photometric assays). It is widely used in QC because it is fast, repeatable, and easy to validate with standards and calibration curves, especially when the matrix is controlled. Instrument choice is typically driven by sample volume, throughput, and whether measurements are performed in standard cuvettes or microvolume formats.
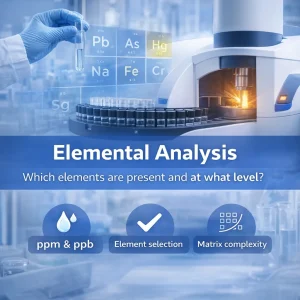
2) Metals / Heavy Metals (Trace Elements)
Use this section when you need elemental results for compliance, contamination control, and material verification—where the analytical question is “which elements are present and at what level?”. Selection is mainly driven by required detection limits (ppm vs ppb), number of target elements, sample form (solid screening vs dissolved sample), and matrix complexity. In many industrial workflows, rapid screening is followed by confirmatory quantification for reporting. For routine alkali metals in simple matrices, dedicated flame methods remain practical and efficient.
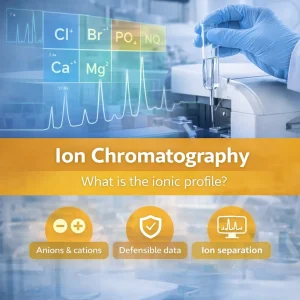
3) Ions in Water (Anions / Cations)
This section is for aqueous samples where the targets are inorganic ions and the goal is to determine the ionic profile. When you need selective, defensible quantification of multiple anions/cations (especially for regulated reporting), ion chromatography (IC) is typically the most reliable choice—because it separates ions before measurement.
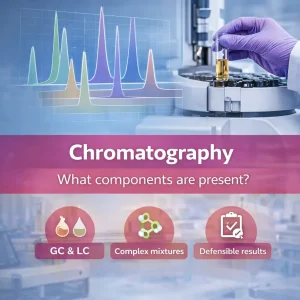
4) Impurities & Complex Mixtures (Separation Needed)
Choose this section when a bulk signal is not sufficient because samples contain multiple components—impurities, related substances, additives, or complex formulations—where separation is required before quantification. Selection is driven by analyte volatility/thermal stability (GC vs LC), expected impurity levels, matrix complexity, and the robustness of sample preparation. These workflows are preferred in regulated and release-testing contexts because they generate component-resolved results that are easier to defend, troubleshoot, and trend over time.
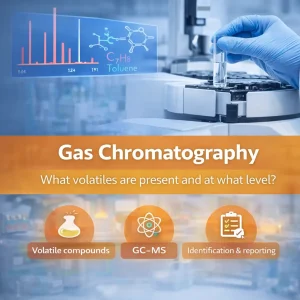
5) Gases & Volatile Compounds (VOCs / Solvents)
This section applies when targets are volatile or semi-volatile—VOCs, residual solvents, volatile contaminants—and the question is “what volatile compounds are present and at what level?”. Gas chromatography is the standard route because it separates volatile components efficiently; coupling with MS strengthens compound identification when complex profiles or unknown peaks are involved. Selection is typically driven by volatility range, required identification confidence, and reporting requirements for residual solvents or volatile impurities.
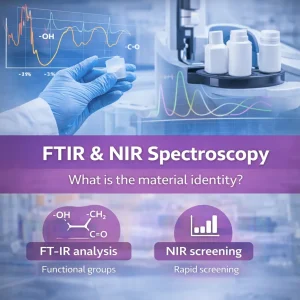
6) Material Identification (Polymers / Functional Groups)
Use this section when the main requirement is rapid, practical confirmation of material identity—especially polymers, raw chemicals, and unknown materials—based on spectral fingerprinting. FT-IR is typically used for functional group identification and material confirmation, while NIR is widely used for fast, non-destructive screening once a reference library or chemometric model is established. Selection depends on whether you need definitive functional group information (FT-IR) or high-throughput screening and classification (NIR).
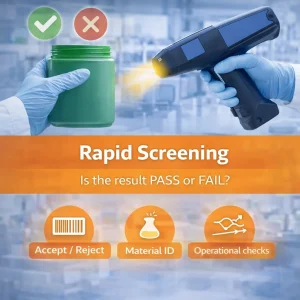
7) Rapid Screening / Incoming QC
This section supports fast decision-making in incoming inspection and high-throughput screening where the goal is verification, classification, or pass/fail checks rather than deep compositional analysis. It is often used to prevent material mix-ups, catch obvious out-of-spec lots early, and support operational checks close to production. Selection depends on what you are screening (material identity, elemental screening, or operational parameters such as flow stability) and how quickly results are needed with minimal workflow complexity.
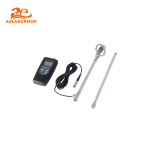
8) Thermal Stability / Moisture / Ash
Choose this section when temperature-driven behavior is part of acceptance criteria—moisture/volatile content, decomposition profile, residue/ash, and thermal transitions that affect stability and processing. TGA is used when the key output is mass change versus temperature (moisture loss, decomposition stages, ash/residue), while DSC targets thermal transitions such as melting, glass transition, and crystallization behavior. Selection depends on whether you need mass-loss information, thermal transition data, or both for a complete stability picture.
9) Crystal Phase / Polymorph Identification
Choose this section when temperature-driven behavior is part of acceptance criteria—moisture/volatile content, decomposition profile, residue/ash, and thermal transitions that affect stability and processing. TGA is used when the key output is mass change versus temperature (moisture loss, decomposition stages, ash/residue), while DSC targets thermal transitions such as melting, glass transition, and crystallization behavior. Selection depends on whether you need mass-loss information, thermal transition data, or both for a complete stability picture.
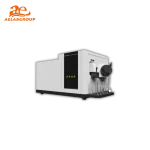
10) Fluorescence-based Tests (High Sensitivity Assays)
Use this section when fluorescence provides higher sensitivity than absorbance—common in dye/labeled assays, trace fluorescent compounds, and research workflows requiring strong signal-to-noise. A fluorometer is often sufficient for routine fluorescence measurements at fixed excitation/emission settings, while a fluorescence spectrometer supports broader spectral scanning and method flexibility for development, optimization, and more complex samples. Selection depends on whether the workflow is standardized routine testing or method development with spectral exploration.
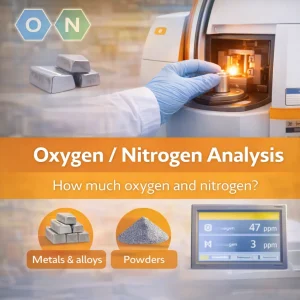
11) Oxygen & Nitrogen Content (Materials / Metals)
This section is dedicated to measuring oxygen and nitrogen content in materials where O/N levels directly impact performance and quality—especially metals, alloys, powders, and advanced materials. These measurements are used for certification, process control, and contamination monitoring when elemental gas content is a critical specification. Selection is simple: if your requirement is oxygen/nitrogen content reporting for QA or production control, this analyzer is the dedicated solution rather than trace-metal methods or molecular spectroscopy.
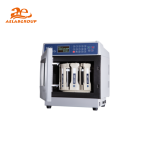
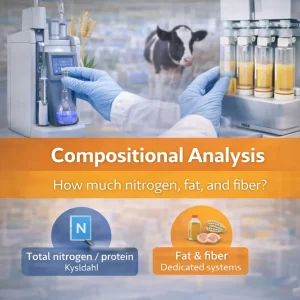
12) Food / Feed Composition (Protein, Fat & Fiber)
This section covers standardized composition parameters used in food, feed, and agricultural QC—where the goal is reporting practical values such as total nitrogen (commonly used as a protein indicator) and fat/fiber content for formulation control, labeling, and batch acceptance. These workflows are method-driven and widely recognized in industry, supporting consistent reporting and trending across production lots. Selection is straightforward: use Kjeldahl for total nitrogen/protein, and dedicated fat/fiber systems for routine compositional metrics.
A) Analytical Equipment Selection (3 Key Questions)
Answer these three questions to quickly narrow down the right technique (and avoid over- or under-specifying the instrument).
1) What is your goal?
• Identify (What is it?) → FT-IR, GC-MS, XRD, reference-based chromatography
• Quantify (How much?) → UV-Vis, HPLC, IC, ICP, AAS, routine analyzers
• Screen/Release (Pass/Fail QC) → NIR, XRF, UV-Vis, method-driven QC
2) How complex is the sample matrix?
The matrix is everything in the sample except the target analyte. More complex matrices usually require:
• Separation (HPLC, GC, IC)
• Higher selectivity (e.g., MS detection, background correction)
• More sample prep (extraction, digestion, cleanup)
3) What performance do you need?
For reliable results, focus on:
• LOD/LOQ (required reporting limit)
• Precision & accuracy (repeatability, bias)
• Calibration strategy (external/internal standards, CRMs)
• Expected range & units (ppm/ppb, %, mg/L, mg/kg)
Share these three inputs (goal + matrix + LOD/LOQ) and we’ll recommend the best category (1–12) and a suitable instrument configuration.
LOD/LOQ definitions: see the general concept of limit of detection (LOD).
B) Technique Map for Analytical Equipment Selection
Use this map as a quick reference to match your application to the right technique family. Each family below connects to one or more of the 12 categories above.
Spectroscopy (fast measurement & routine quantification)
Best for: routine assays, QC checks, and rapid screening when the method is established.
Includes:
• UV-Vis Spectrophotometers → concentration assays (absorbance/colorimetric methods)
• Microvolume (Nano) UV-Vis → very small sample volumes
• NIR Spectrophotometers → rapid, non-destructive screening (often chemometrics-based)
• FT-IR Spectrometers → material identification (functional groups, polymers, fingerprinting)
• Fluorometers / Fluorescence Spectrometers → higher sensitivity assays (native or labeled fluorescence)
When to choose: you need fast measurement and a robust method for your sample matrix (with proper calibration/corrections).
Chromatography (separation for complex mixtures)
Best for: mixtures, impurities, closely related compounds, and samples with overlapping signals.
Includes:
• HPLC → non-volatile / thermally sensitive compounds (liquid-phase separation)
• GC / GC-MS → volatile and semi-volatile compounds (GC-MS adds identity confirmation)
• Ion Chromatography (IC) → anions/cations in water and process samples
• TLC → fast screening, qualitative comparison, and method development support
When to choose: separation is required to achieve selectivity, reliable quantification, or impurity profiling.
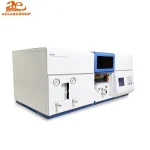
B1) Elemental Analysis (ICP-OES / ICP-MS / AAS / Flame)
Elemental analysis (metals, trace elements & composition control)
Use elemental techniques when the question is: “Which elements are present, and at what level?”
• ICP-OES / ICP-AES → multi-element quantification for routine to mid-trace levels
• ICP-MS → ultra-trace analysis (ppb/ ppt range) and isotope capability when required
• AAS → targeted measurement for specific elements in established workflows (cost-effective for routine labs)
• Flame Photometers → straightforward Na/K (and similar) measurements in relatively clean matrices
When to choose: you need quantified elemental composition, trace metals, contamination control, or quality/compliance reporting.
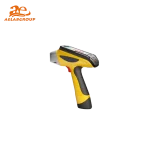
B2) X-ray Techniques (XRF / XRD) for Solids
X-ray techniques for solids (composition & structure)
• XRF → rapid elemental composition analysis for solids/powders; powerful for screening and incoming QC
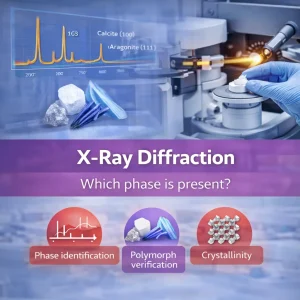
• XRD → crystalline phase identification, polymorph/phase analysis, and crystallinity insights
• Detector options → performance and stability depend on the measurement setup and application requirements
When to choose: you are analyzing solid materials, powders, minerals, or need phase/structure information beyond elemental concentration.
B3) Thermal Analysis (DSC / TGA)
Thermal analysis (stability, composition & material behavior)
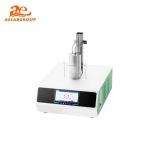
• DSC (Differential Scanning Calorimetry) → thermal transitions (melting, crystallization, glass transition); useful for polymers, pharma, and materials R&D/QC
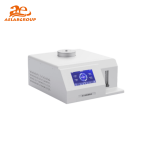
• TGA (Thermogravimetric Analysis) → mass change vs temperature/time; moisture/volatiles, ash content, decomposition and oxidation behavior
When to choose: you need thermal stability validation, transition temperatures, or mass-loss related composition (moisture/volatiles/ash).
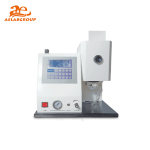
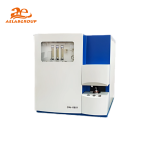
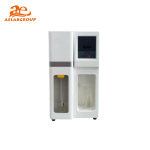
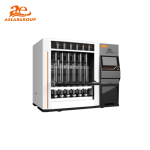
B4) Specialized Analyzers for Standard Methods (Kjeldahl / O-N / Fat-Fiber)
Specialized analyzers for standardized methods
Some applications follow defined reference methods and are best served by dedicated analyzers:
• Kjeldahl Nitrogen Analyzers → total nitrogen (commonly used as a proxy for protein in food/feed)
• Oxygen & Nitrogen Analyzers → O/N determination in metals and materials QC
• Fat/Fiber Analyzers → compositional parameters in food and agricultural products
When to choose: you work with established reference methods and need a streamlined, repeatable workflow.
C1) Sample Preparation Determines Result Quality
Sample preparation determines result quality
Many analytical problems are not caused by the instrument—they come from the sample and the preparation workflow. Preparation steps (filtration, extraction, digestion, dilution, homogenization, cleanup) reduce matrix effects, improve precision, lower contamination risk, and make calibration more reliable.
Common failure modes:
• Contamination introduced during handling or digestion
• Incomplete extraction or digestion
• Carryover between samples
• Calibration standards that do not match the real matrix
A clean analytical workflow is usually: sampling → preservation/storage → preparation → measurement → QC checks → reporting.
C2) Performance Metrics That Matter
Performance metrics that matter (beyond “it works”)
When evaluating method fit and instrument performance, focus on:
• LOD/LOQ → the lowest level you can detect/quantify with confidence
• Precision → repeatability under the same conditions
• Accuracy → closeness to the true value (often verified with reference materials)
• Selectivity / interferences → ability to measure the target in the presence of others
• Linearity / calibration stability → reliability of the calibration over the working range
• Throughput → samples per unit time
• Robustness → sensitivity to small variations in operator technique or environment
C3) Where Analytical Instruments Are Used
Used across QC/QA, R&D, and routine laboratory workflows in industrial, environmental, food, and pharmaceutical settings.
D) Next Step
From technique to instrument specification
Once you have the right technique family, review the corresponding instrument options for key specifications, configuration choices, and application notes. This is the most reliable way to match an instrument to your sample type, required LOD/LOQ, and workflow needs.
Author: AELAB (Applications Team)
Technical review: Verified for technical accuracy by AELAB.
Last updated: 2026-02-11
FAQ (Frequently Asked Questions)
Technical review
This guide is technique-focused. When implementing a method, follow the applicable standard for your industry (e.g., EPA/ISO/ASTM/USP) and your internal SOP.