AELAB | Analytical Equipment | TLC
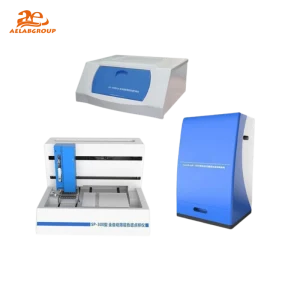
Thin Layer Chromatography Scanner systems enable fast, reproducible densitometric measurement of TLC/HPTLC plates for qualitative and quantitative analysis. By converting separated spots or bands into measurable optical signals, a TLC scanner supports reliable identification, purity checks, and assay workflows in modern analytical laboratories.
A Thin Layer Chromatography Scanner is a densitometry-based instrument designed to scan TLC or HPTLC plates after separation. It measures absorbance, reflectance, or fluorescence across the plate (often at selected wavelengths) to generate chromatograms, quantify components, and document results. Compared to visual inspection, scanning improves sensitivity, repeatability, and data traceability—especially when combined with controlled illumination, precise positioning, and validated analysis software.
| Feature | Details |
|---|---|
| Supported plates | TLC and HPTLC plates (typical sizes up to 20 × 10 cm and similar formats) |
| Detection modes | Absorbance/reflectance densitometry and optional fluorescence measurements |
| Light sources | UV and visible illumination (commonly includes UV 254/366 nm plus white light for documentation) |
| Wavelength selection | Selectable wavelengths via filters/monochromator depending on model; supports compound-specific detection |
| Scanning geometry | High-precision slit/spot scanning across lanes or full-plate scans for imaging and densitograms |
| Quantification | External/internal calibration curves, peak integration, Rf tracking, and batch processing |
| Data integrity | Audit-ready electronic records, method templates, and standardized reports (capability depends on software) |
| Connectivity and reporting | Export of chromatograms/images to common formats; optional LIMS/CSV/PDF reporting workflows |
| Aspect | Thin Layer Chromatography Scanner | TLC Visualizer (UV Cabinet) |
|---|---|---|
| Primary output | Quantitative densitograms + images | Visual inspection + plate photos |
| Quantification | Supports calibration curves and peak integration for assays | Limited; typically qualitative or semi-quantitative at best |
| Sensitivity & repeatability | Higher; controlled optics and automated scanning reduce variability | Operator-dependent; lighting and viewing conditions affect results |
| Data integrity & reporting | Structured methods, audit-ready records (software dependent) | Basic image archiving; less analytical metadata |
| Best use-case | Routine QC, validated quantitation, multi-wavelength confirmation | Quick spot checking, method scouting, simple documentation |
Q: What is the difference between TLC and HPTLC scanning?
A: Both use densitometry, but HPTLC typically involves higher-performance plates and more standardized application/development steps, which can improve resolution, sensitivity, and quantitative repeatability when scanned.
Q: Can a Thin Layer Chromatography Scanner provide quantitative results?
A: Yes. With appropriate standards, calibration curves, and validated parameters (e.g., wavelength, slit size, and scanning speed), a TLC scanner can quantify analytes by integrating peak areas or heights.
Q: Which detection mode should I choose: absorbance/reflectance or fluorescence?
A: Absorbance/reflectance is common for UV-active or colored compounds, while fluorescence is ideal for fluorescent analytes or samples that are derivatized to fluoresce, often improving sensitivity and selectivity.
Q: What factors most affect repeatability in TLC scanning?
A: Consistent sample application, uniform plate development, controlled drying/derivatization, precise lane positioning, stable illumination, and standardized integration settings in the software are the most important contributors.
Q: Do I need dedicated software for a TLC scanner?
A: For quantitative work and robust reporting, dedicated software is strongly recommended because it manages calibration, peak integration, method templates, and consistent documentation across runs.
Looking for specific lab equipment? Fill out the form below, and our team will get back to you with detailed information and a personalized quote.